

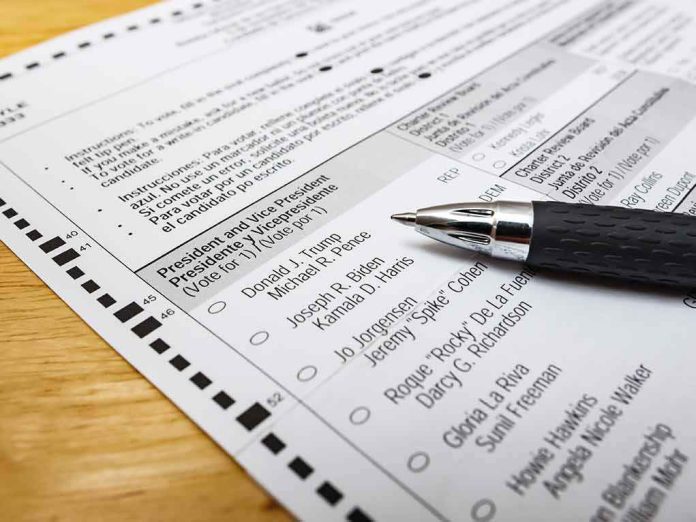
Generic-ballot leads are headlines; seat math, maps, and turnout are what move power. Treat a mid-cycle Democratic edge as real but provisional—the difference between a blue ripple and a blue wave is whether motivation and malapportionment-proof margins hold through Election Day.
The Short Version
- Democrats show a mid-cycle advantage on the generic congressional ballot, with several credible trackers placing them up by roughly 4–6 points—enough to matter, not enough to guarantee a wave.
- Motivation asymmetry is the Democrats’ clearest asset: among voters reporting the highest intent to participate, Democrats post double-digit leads in some analyses, a critical lever in lower-turnout midterms.
- Structural headwinds—district maps, seat distribution, and the historical decay of early leads—can translate a popular-vote edge into modest gains unless the margin expands or turnout models break their usual patterns.
- A single tight poll does not defeat an average; nor does an average immunize against late shifts, model error, or redistricting changes. The prudent read is advantage Democrats, with volatility intact.
What the generic ballot can tell you—and what it can’t
The generic congressional ballot—“Which party would you support for Congress?”—is a blunt but useful national thermometer. It captures macro mood, not district-by-district combat. Historically, a sustained national advantage correlates with seat gains, but the conversion ratio varies widely because votes are inefficiently distributed. Democrats can win the national House popular vote by several points and net only a handful of seats if those extra votes pile up in already-safe districts. This is why analysts watch the average across multiple pollsters, not any single outlier, and why they speak in ranges rather than certainties when a lead sits in the mid-single digits.
In the present cycle, reputable write-ups and trackers have described a Democratic edge that, averaged across polls, has hovered in the mid-single digits—stronger than their 2024 deficit and suggestive of a notable swing toward the party. On its face, that is meaningful. But the line between “enough to flip control decisively” and “enough to make the map competitive” is narrow; in modern House elections, it typically takes something close to a five- to six-point national margin to make a majority likely, and even then the final seat tally depends on how that vote is distributed across swing districts.
Why motivation asymmetry matters more in midterms
Midterms are participation contests before they are persuasion contests. Turnout routinely drops from presidential-year highs, so differences in who shows up can swamp small shifts in preference. When survey crosstabs show Democrats leading by double digits among the “extremely motivated,” that is not trivia; it is a plausible mechanism through which a mid-single-digit national edge becomes more potent where it counts, especially in suburban seats that hinge on habitual voters and high-propensity newcomers. If that motivation gap persists into the last 60 days—when campaigns are optimizing door knocks, absentee chase, and early-vote mobilization—it can harden into a durable advantage.
Still, turnout modeling is where polls most often miss. The public sees a margin of error of ±3 and assumes precision; professionals budget for a “true” error band closer to twice that once you include non-sampling error—nonresponse bias, late swings, and miscalibrated likely-voter screens. That is why close races are hard to call even a week out, and why a June or July snapshot should be read as direction, not destination.
Counter-claims, weighed properly: one tight poll versus the averages
Critics point to individual surveys—such as a Marquette reading putting Democrats up by a single point—arguing that a lead within the margin of error is functionally no lead at all. That caution is fair about any one poll. But the stronger standard is the multi-poll average, which smooths house effects and sampling noise. In this cycle, averages compiled by independent analysts still show a Democratic advantage larger than the knife’s edge described by that isolated result. The implication is not inevitability; it is simply that the central estimate, across methods and sponsors, remains modestly blue-tilted.
A second counter-argument claims Democrats “need” a five- to six-point national win to secure the House. As a rule of thumb, that threshold reflects contemporary map geometry and the geographic concentration of Democratic votes. It is not a law of nature; it is an empirical regularity with wide error bars. If Democrats’ advantage is front-loaded in the kinds of suburban battlegrounds that actually decide control, a smaller national margin can suffice. If it is concentrated in deep-blue metros, a larger national win can still underperform in seats. The only rigorous way to adjudicate that claim is district modeling—and those models, like polls, inherit the same uncertainties.
Structural forces between polling leads and real power
Three structural factors mediate any “blue wave” headline. First, the map: mid-decade line changes or court-ordered redraws can tilt the playing field. A modest national edge set against a map that subtly favors Republicans yields muted seat gains; the reverse is also true. Second, the seat baseline: flipping a chamber requires prying loose marginal incumbents whose districts were drawn to be resilient. Third, the urban-suburban-rural split: Democrats’ vote is more spatially concentrated, which means they bank oversized majorities in safe districts and waste votes unless their gains broaden geographically. These forces are why analysts who see a D+4 national environment can, with a straight face, forecast anything from status quo to majority depending on where those points accrue.
History adds a final caution. Mid-year generic advantages have a habit of decaying or translating inefficiently. In 2018, a mid-cycle D+5 presaged a genuine wave. In 2020 and 2022, mid-cycle Democratic edges either softened or converted into modest gains or stalemates when the ballots were counted. Polls remain valuable, but their miss pattern—especially when Donald Trump is salient—has been asymmetric at times, and the total error in practical terms often exceeds the neat sampling margin reported atop the topline.
Motivation, antipathy, and the Trump factor
Another through-line of the current data is the relationship between Trump’s standing and down-ballot intent. When a large share of voters who disapprove of Trump report preferring Democrats for Congress, it signals a negative partisanship engine that has powered previous Democratic midterm successes. The mechanism is straightforward: presidential out-party voters feel urgency; in-party skeptics can become demobilized. Whether that persists depends on what dominates late-cycle news—economy, courts, or cultural fights—and whether those stories galvanize one side’s low-propensity voters more than the other’s.
Prediction markets and expert aggregates often echo the polls in assigning Democrats an edge for the House and a murkier picture in the Senate—an asymmetry driven by map topology rather than national mood. Markets are not oracles; they are consensus bets that incorporate, and sometimes overweight, the very polls they watch. They are useful as a synthesis, not as independent proof.
“100+ Florida subpoenas” proves no crime, much less some grand Democratic conspiracy, and investigations aren’t convictions. Meanwhile, actual midterm polling has shown Democrats ahead nationally; including an Emerson poll with a 10-point generic-ballot lead.
— ICURUOK (@ICURUOK1) July 5, 2026
How to read the next six months without getting whiplash
For readers who track this professionally, three diagnostics earn more weight than any single poll release. One: the trajectory of the credible-poll average—if the Democratic margin widens and stabilizes above the mid-single digits by late summer, wave talk has a basis; if it compresses to parity, the House becomes a coin toss at best. Two: high-quality likely-voter screens converging on a durable motivation gap; if the “extremely motivated” Democratic edge remains double-digit into October, expect turnout operations to lock in that advantage. Three: district-level polling and fundraising in the true battlegrounds—if Democrats post persistent small leads and cash advantages in Biden+1 to Biden+5 seats currently held by Republicans, the seat math begins to break their way irrespective of the national popular vote.
Bottom line: advantage Democrats, with structural and statistical caveats
Put simply, the preponderance of evidence points to a Democratic-leaning national environment heading into the midterms: mid-single-digit generic-ballot leads across independent trackers, a plausible turnout advantage among the most motivated voters, and issue mixes that have, in recent cycles, energized Democratic coalitions. That describes conditions for gains—not a guarantee of a wave. Map geometry, the conversion inefficiency of Democratic votes, and the well-documented limitations of polling—particularly early and in electorates influenced by Trump-era dynamics—inject real uncertainty. Read the averages, not the outliers. Weight motivation and maps as heavily as margins. And remember that in the House, three points can change the storyline; six points can change power.
Sources:
feedpress.me, facebook.com, brookings.edu, opiniontoday.substack.com